eCommerce Performance and Reliability Engineering
Improve eCommerce speed and reliability across Core Web Vitals, storefront rendering, APIs, databases, queues and checkout. We measure before changing and verify against comparable evidence.
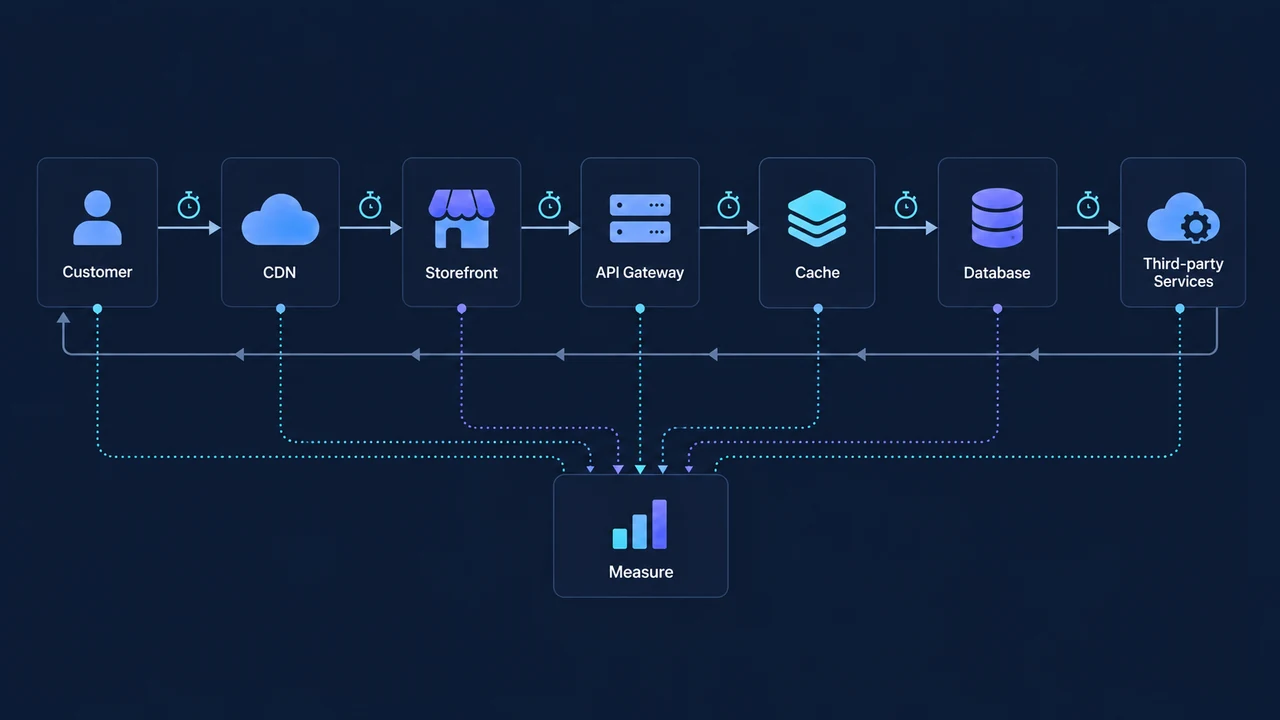
Optimisation begins with a representative journey and baseline.
- Typical first step
- Select the commercial journey and the evidence used to judge change.
- Inputs we need
- RUM or analytics, monitoring, traces, code access, environments and incident history.
- Outputs
- Baseline, diagnosis, remediation backlog, verified changes and regression controls.
- Working format
- Focused audit, implementation or an embedded improvement stream.
Field, lab and load evidence answer different questions.
A single Lighthouse score cannot explain production behaviour. The measurement mix follows the failure mode.
Real-user monitoring
Shows user segments, devices and production distributions.
Needs representative traffic and consistent event definitions.Lab and tracing
Makes rendering and request paths reproducible.
Useful for diagnosis, not a substitute for field outcomes.Load and resilience
Tests capacity, saturation and degradation behaviour.
Requires realistic journeys, data and safe environments.Replace isolated scores with a traceable performance budget.
- Teams optimise a homepage lab score while checkout remains slow.
- Frontend, API and database symptoms are investigated separately.
- Peak capacity is assumed from infrastructure size.
- Improvements ship without a comparable measurement window.
- Budgets follow critical journeys and user segments.
- Traces connect browser, API, database and dependencies.
- Load tests reveal saturation and degradation paths.
- Verification uses the agreed baseline method and window.
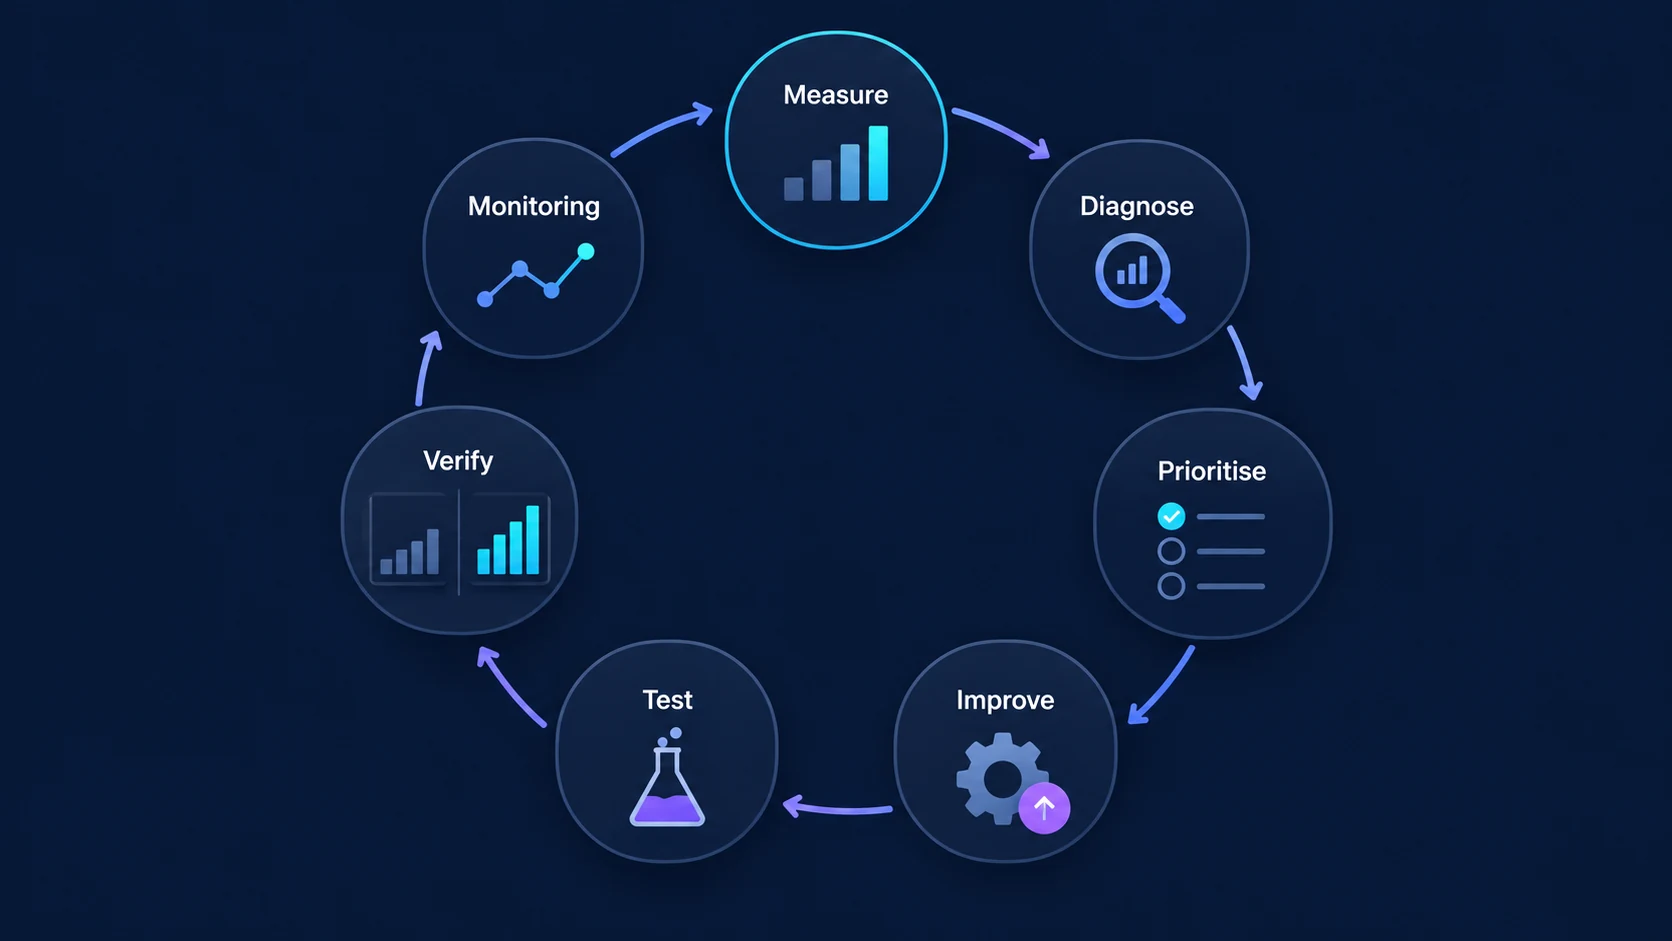
Baseline → Diagnosis → Remediation → Verification
Baseline
Representative journeys, segments and available telemetry.
Define metrics and capture comparable evidence.
Baseline and measurement plan.
Diagnosis
Baseline, traces, profiles and dependency data.
Locate bottlenecks and causal chains.
Prioritised findings with evidence.
Remediation
Approved findings, code and environments.
Implement focused changes and quality gates.
Tested changes and release plan.
Verification
Released changes and the agreed measurement window.
Compare like-for-like field, lab or load evidence.
Verification report and regression budget.
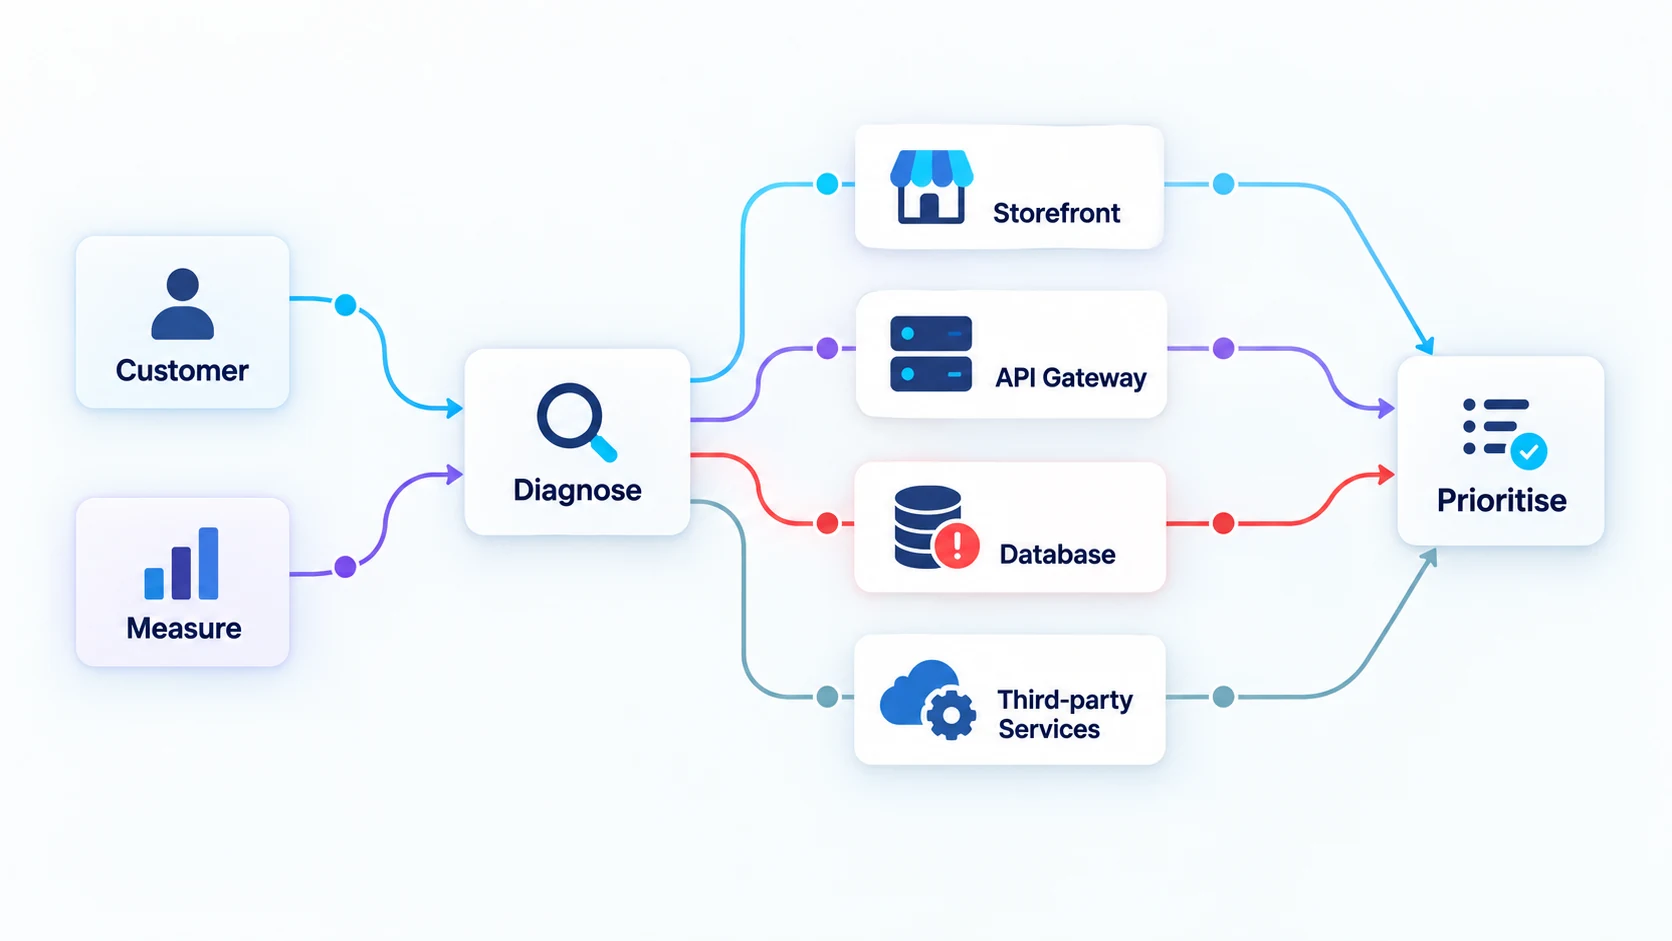
Performance work across the full request path.
Storefront and Core Web Vitals
Rendering, assets, scripts and interaction diagnosis.
Boundary: Third-party vendor changes require their cooperation.Backend and APIs
Latency, concurrency and dependency analysis.
Boundary: A rewrite is not assumed.Database and cache
Query, index, cache and contention evidence.
Boundary: Data-model redesign is separately scoped.Checkout reliability
Critical dependency and failure-path review.
Boundary: Payment-provider availability is external.Peak-load readiness
Workload model, tests and bottleneck report.
Boundary: No capacity guarantee without agreed conditions.Regression controls
Budgets, dashboards and release checks.
Boundary: Ongoing monitoring response is separate.Improve the commerce journey that fails under real conditions.
Performance and reliability engineering connects customer-facing speed with backend, dependency and peak-load behaviour.
- Storefront and checkout performance on representative journeys.
- API, cache, database and third-party bottlenecks.
- Load, resilience, monitoring and regression controls.
Example verification record.
Illustrative structure only — not a client case or a performance claim.
01JourneyUser segment and environment
02BaselineMetric, distribution and measurement window
03ChangeHypothesis and affected request path
04VerificationSame method, observed difference and caveats
Outputs
Included
- 01Journey baseline
- 02Core Web Vitals segment view
- 03Trace and dependency analysis
- 04Load-test scenario and results
- 05Remediation backlog
- 06Performance budgets and dashboards
Team shape
A performance specialist, the relevant frontend or backend engineer, and a quality specialist; the journey under test determines the mix.
Code and IP
The client owns the project-specific code and agreed deliverables after payment; third-party licenses and pre-existing tools keep their original terms.
Handoff and support
Handoff includes agreed repositories, documentation and knowledge transfer. Ongoing support is a separate scope unless included in the engagement.
Not included by default
Guaranteed Lighthouse scores and guaranteed conversion uplift are excluded. Third-party vendor fixes and permanent incident response also require explicit agreement.
Price factors
Journey count, telemetry quality, code and environment access, stack breadth, traffic model, test-data needs and remediation depth.
What affects an eCommerce performance optimization engagement?
The scope depends on the journey, evidence and failure mode. A lab score alone cannot estimate production remediation or prove a business outcome.
| Factor | Effect on scope | Evidence needed |
|---|---|---|
| Target journey | Product discovery, PDP, cart, checkout and account flows have different browser and backend paths. | Priority routes, user segments, devices and commercial criticality. |
| Evidence quality | Field data, traces, logs and incident history reduce guesswork and narrow experiments. | RUM, analytics, APM, logs, deployment history and comparable windows. |
| System breadth | Frontend, API, database, search, cache, queue and infrastructure ownership may cross teams. | Architecture context, repository access and named component owners. |
| Peak and resilience tests | Capacity work needs realistic traffic, data, environments and safe failure exercises. | Traffic profile, test data, rate limits, rollback and test-environment constraints. |
| Verification window | Some fixes can be lab-verified quickly; field distributions need sufficient representative traffic. | Baseline, performance budget, release date and agreed acceptance signals. |
Start with the journey, metric and environment.
Can you guarantee a Lighthouse score?
No. We optimise representative journeys and production experience; a lab score alone is not a business outcome.
Do you work on backend performance?
Yes. We can trace requests through APIs, databases, caches and external dependencies.
How is improvement verified?
The baseline defines the method, segment and measurement window; the same conditions are used after release where possible.
Can you prepare for peak traffic?
We can model and test critical paths, but any capacity statement is limited to the agreed workload and environment.
Start with the journey, metric and environment.
After contact we define the baseline and available evidence, then set the diagnostic boundary.
Review a performance issue →